.jpg)
VC Secondary Market Trends | July 2025 | PM Insights
Institutional secondary market-driven data insights covering a universe of private venture-backed companies.
August 5, 2025

|| August 5, 2025
PM Insights offers a comprehensive look at private market activity, covering sector trends, company-level insights, and monthly performance metrics.
The July 2025 report highlights movements in ROI, volatility, trading volumes, spreads, and valuations, while tracking institutional involvement and comparing current secondary market prices to recent funding rounds.
Key Takeaways
- PM50 Growth’s ROI has stayed positive since mid-2023, following a year of negative returns. It reached +3.60% in July 2025 after peaking at +15.33% in February 2025.
- Sell-side activity remained dominant in July 2025, with asks accounting for 60.44% of the $7.50 billion in total volume.
- In July 2025, the average ask volume rose to $12.21M (+65.4%), the average trade volume climbed to $3.38M (+46.3%), the average bid volume dipped to $14.31M (−5.3%), and the average total volume increased to $10.86M (+26.4%) compared to June 2025.

ROI Private & Public
|| ROI from December 31, 2024 until July 31, 2025
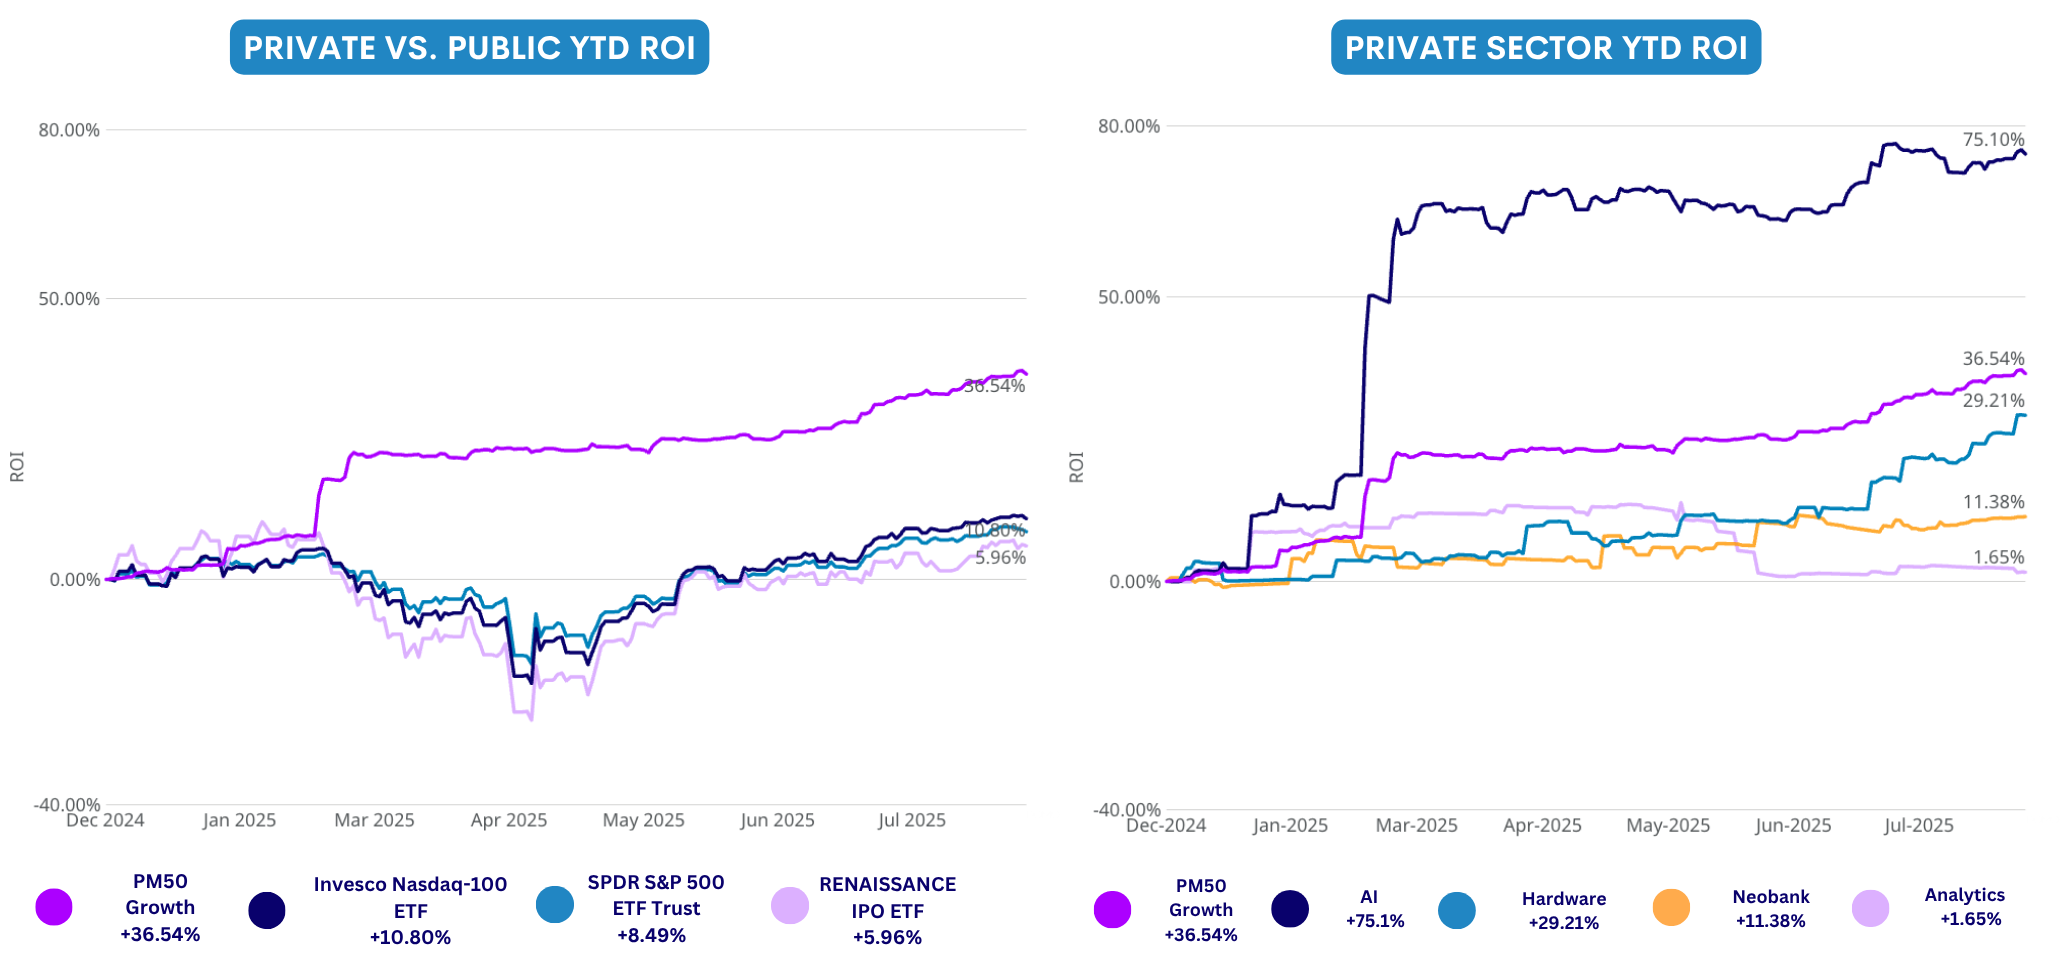
The PM50 Growth tracks the performance of the 50 most active private names observed in the secondary market. It is an equal-weighted index, rebalanced on a monthly basis.
This rebalancing of constituents over time gives way for more active names to participate in what we observe as "market performance," and in a more appropriate manner than static selections and weightings criteria.
Private Market: Sector Level for July, 2025
|| Sector-level analysis for July, 2025
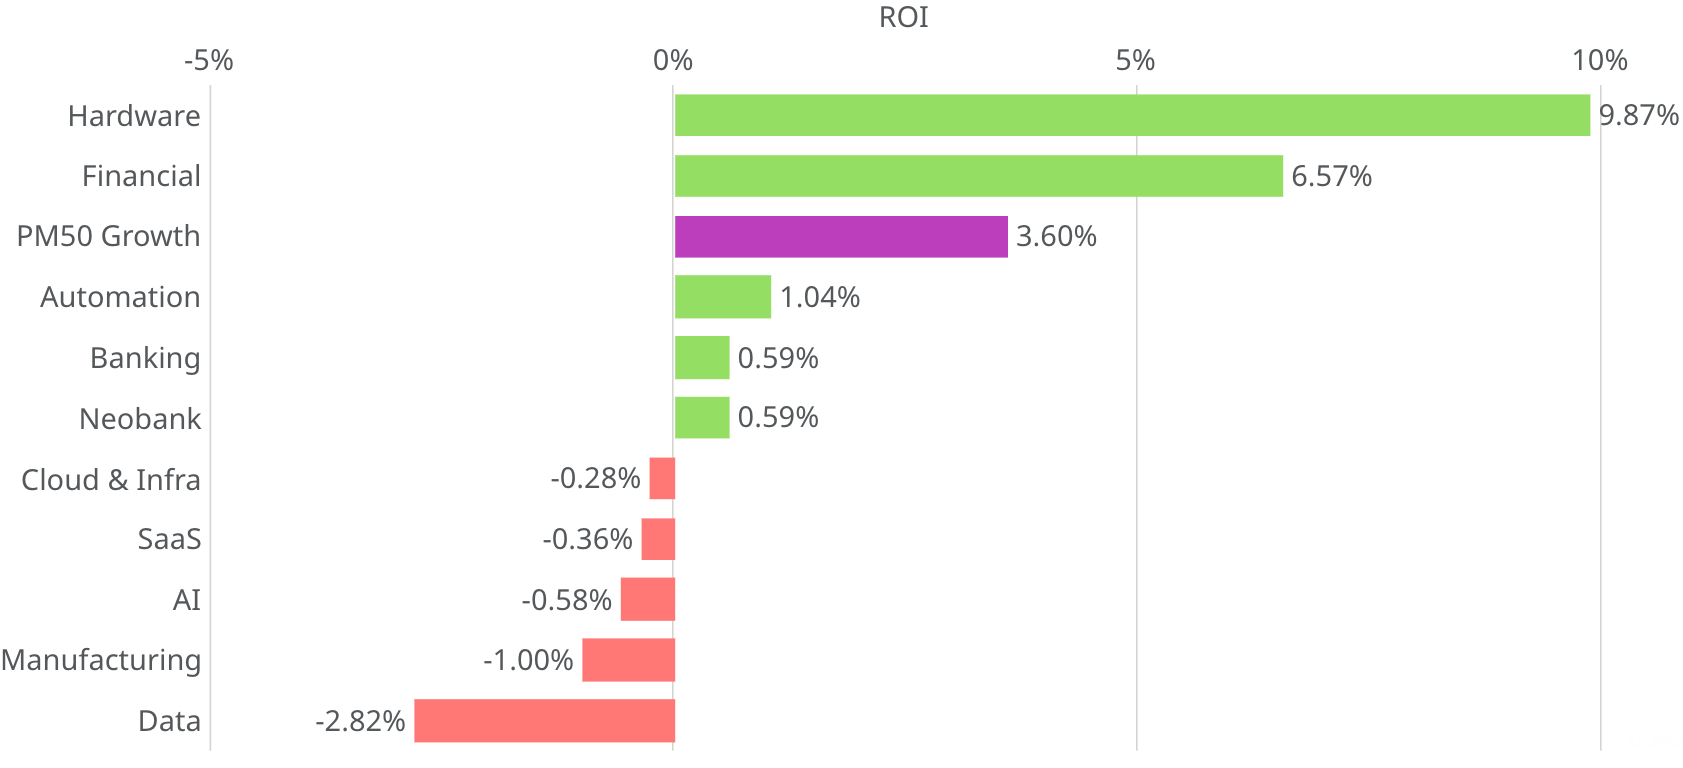
MoM Return on Investment (ROI)
The graph below displays the MoM ROI, broken down by PM Insights’ actively tracked sectors, covering the period from June 30, 2025 to July 31, 2025.
- Strongest gain: Hardware topped sector performance with a 9.87% gain, signaling strong momentum
- Weakest return: Data sector declined -2.82%, marking the weakest return this month
- PM50 Growth saw a healthy 3.60% gain, maintaining steady upward movement
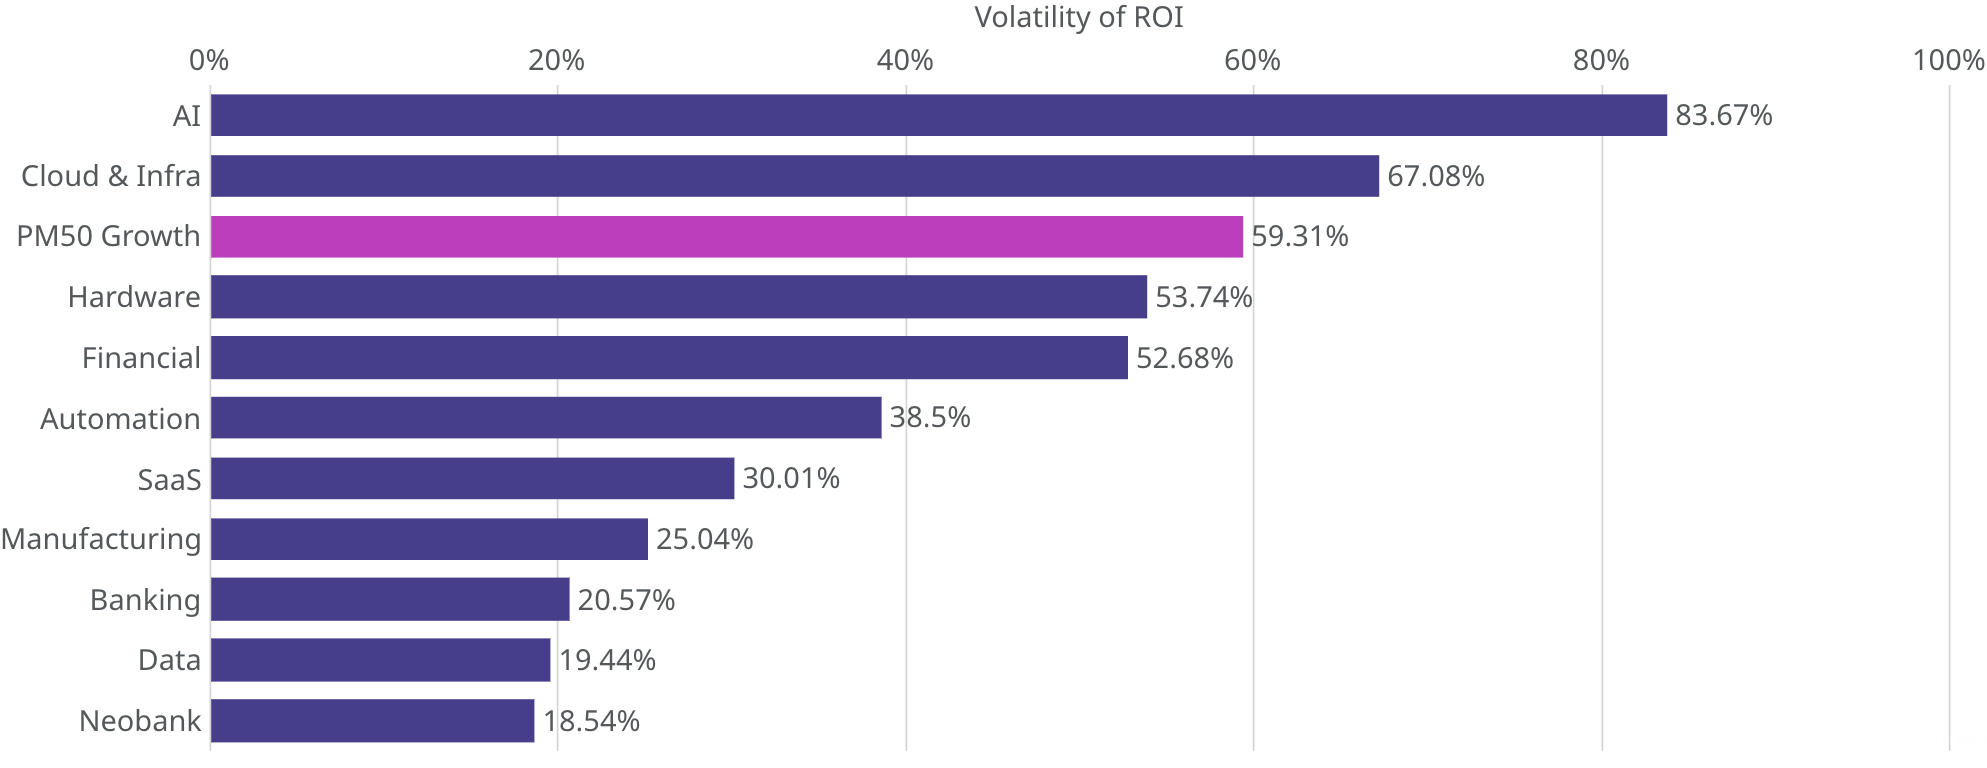
Volatility of ROI
The volatility of the ROI is calculated based on the ROI movements within a 90-day rolling window ending on that date. The graph below illustrates volatility of ROI across various sectors on July 31, 2025.
- Highest volatility: AI sector recorded the highest volatility at 83.67%, reflecting significant price swings and investor uncertainty
- Lowest volatility: Neobank sector exhibited the lowest volatility of 18.54%, suggesting more stable performance during the period
- PM50 Growth showed a volatility of 59.31%, indicating notable but comparatively lower fluctuations than those in the AI and Cloud & Infra sectors
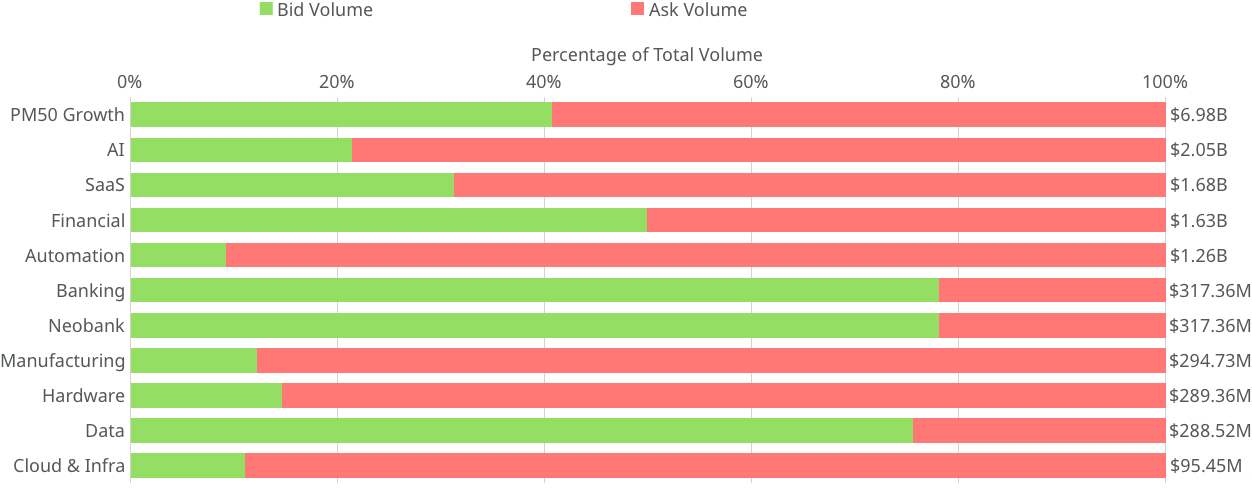
Total Bid and Ask Volume Ratio in July
The stacked bar chart below highlights total ask and bid volumes, along with their ratios, across sectors for selected companies with notable activity during the time period between July 1, 2025 and July 31, 2025.
- Highest bid ratio: Both Banking and Neobank sectors saw the highest concentration of buy-side activity, with bids accounting for 78% of their $317.36 million total volume
- Highest ask ratio: Automation sector experienced a strong sell-side skew, with asks comprising 90.00% of its $1.26 billion in volume
- PM50 Growth exhibited a moderate sell-side skew with asks comprising of 59.38% of its $6.98 billion in volume
Monthly Statistics
|| Monthly statistics from January, 2021 until July, 2025
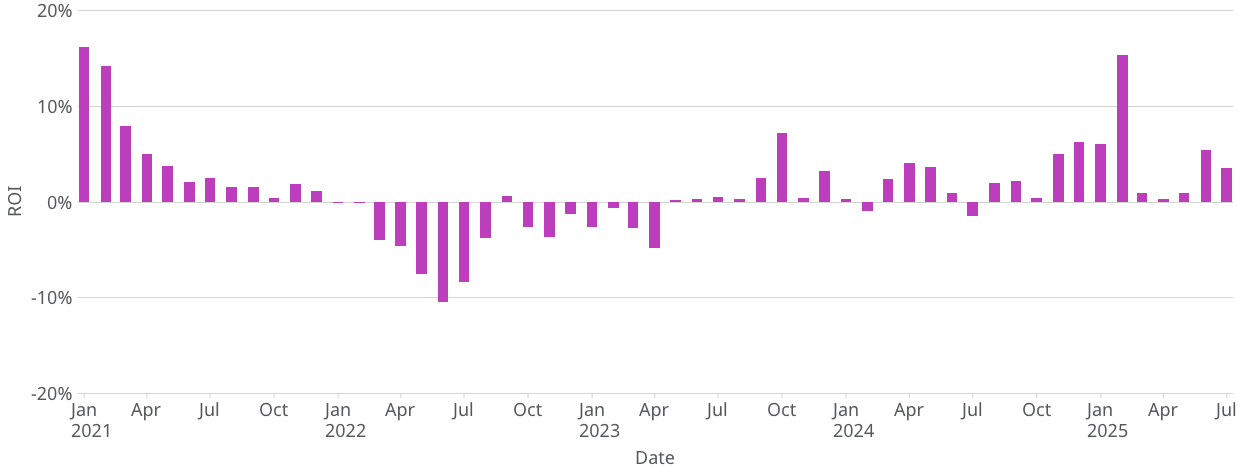
Monthly PM50 Growth ROI
The chart below shows PM50 Growth’s month-on-month ROI.
- January 2021: ROI peaked at +16.25%, signaling strong early performance
- June 2022: ROI hit a low of -10.50% after a steady decline
- Rest of 2022: ROI remained mostly negative, reflecting poor market conditions
- May 2023 onward: ROI began trending positive, with momentum building
- February 2025: ROI reached a post-rebound high of +15.33%
- July 2025: ROI stood at +3.60%
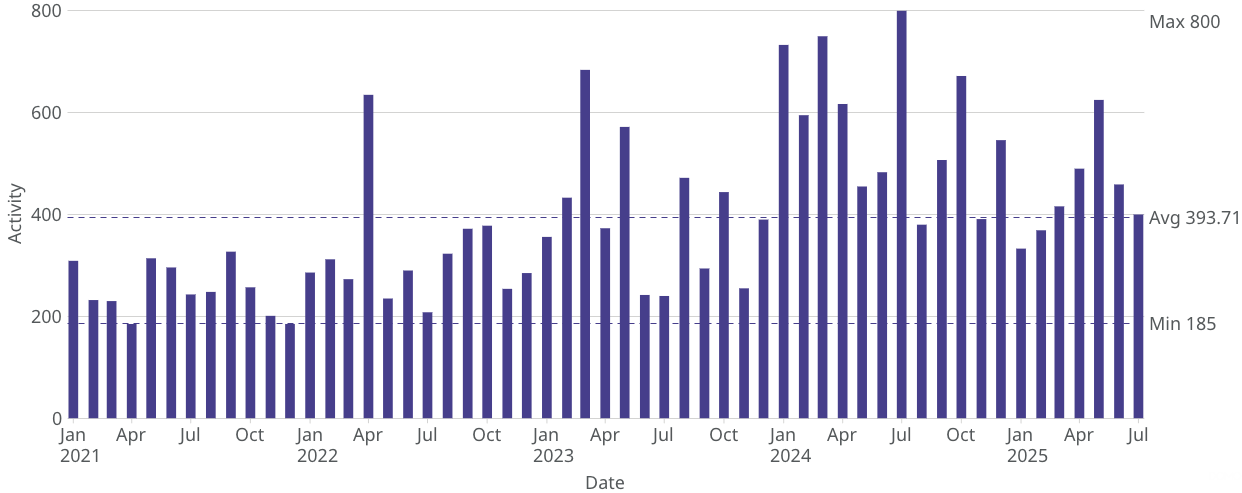
Monthly Institutional Level Activity
The chart below shows the monthly count of institutional-level ($1M+) bid, ask, or trade contributions.
- July 2024: Highest activity with 800 contributions, reflecting strong institutional demand
- April 2022 and March 2023: Notable spikes with 635 and 684 contributions, respectively
- April and December 2021: Lowest contribution counts at 185 each, indicating reduced market interest
- July 2025: Signs of recovery with 400 unique institutional broker contributions, suggesting a gradual return of participation
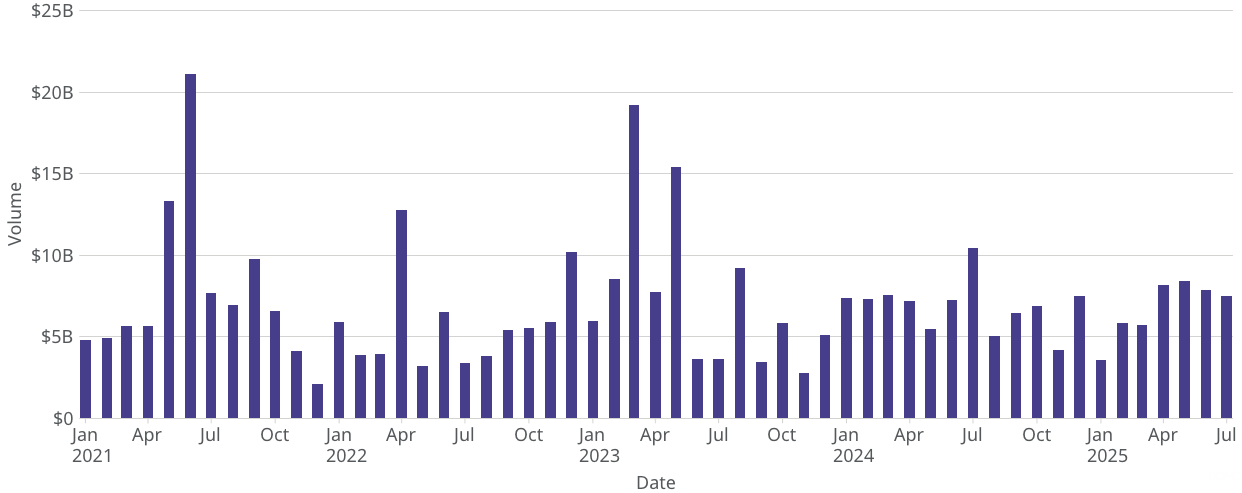
Monthly Total Bid and Ask Volume
The chart below presents total monthly bid and ask volumes tracked by PM Insights.
- June 2021: Peak volume at $21.15 billion, indicating intense market engagement
- April 2022 and March 2023: Significant spikes with $12.79 billion and $19.20 billion, respectively
- December 2021: Lowest volume at $2.12 billion, reflecting reduced trading activity
- July 2025: Volume rose to $7.50 billion, suggesting a gradual market rebound
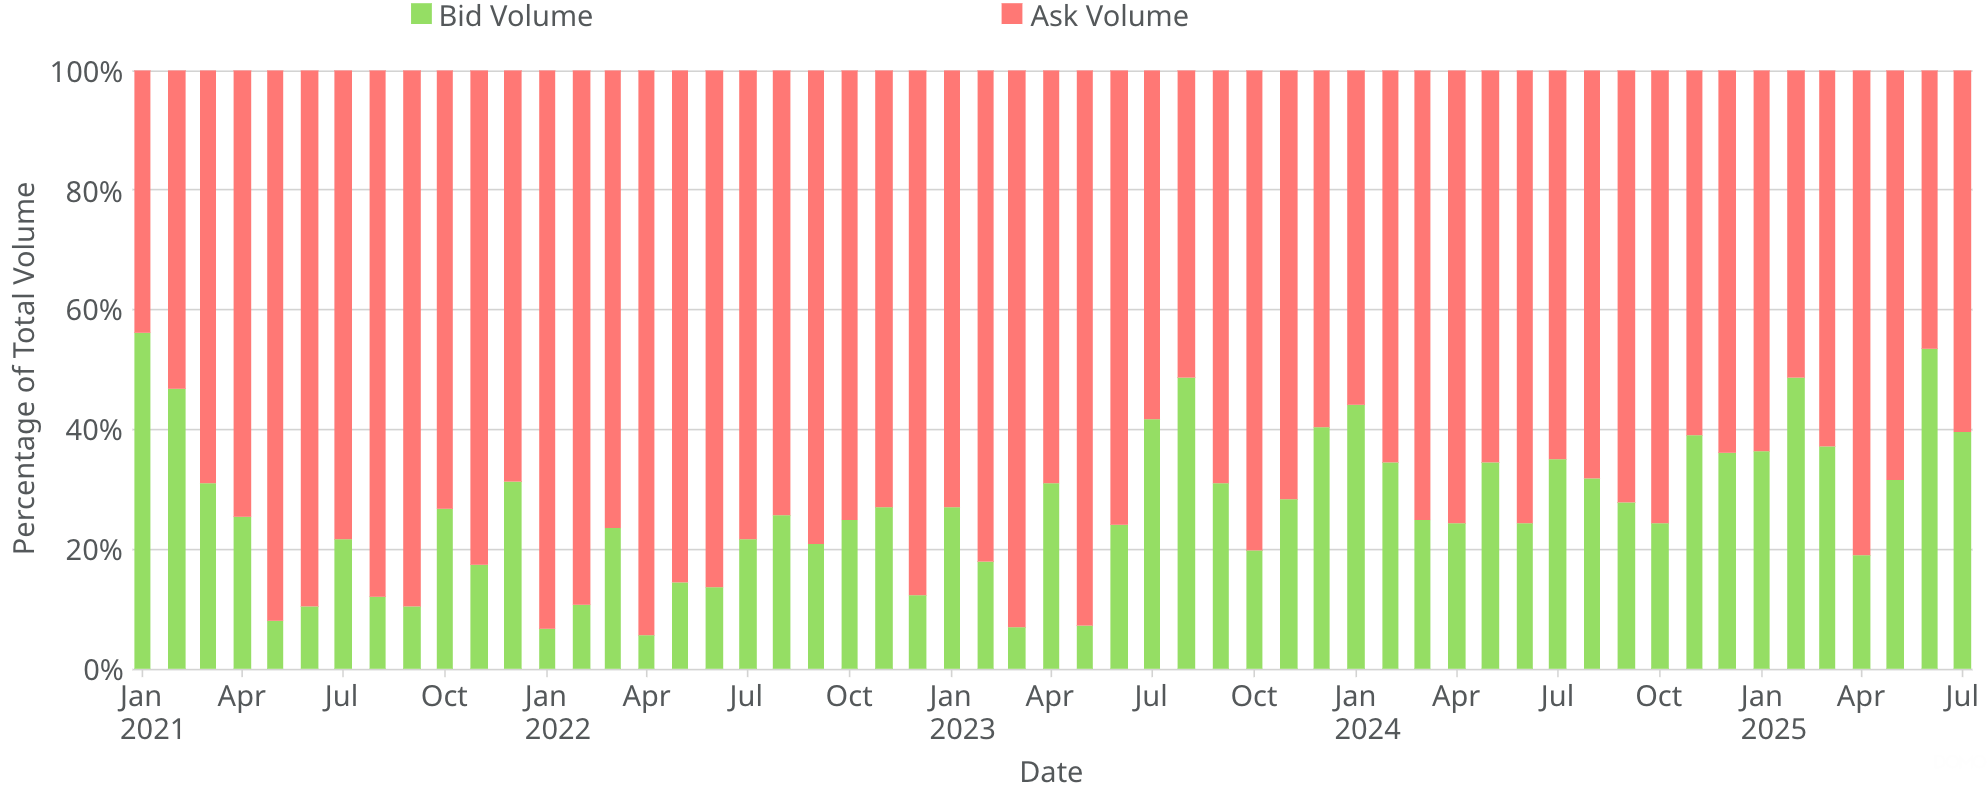
Monthly Bid and Ask Volume Ratio
The stacked bar chart below shows the total monthly bid and ask volumes alongside their relative ratios.
- January 2021: Strongest buy-side activity, with bids accounting for 56.09% of the $4.80 billion total volume
- April 2022: Peak sell-side dominance, with asks making up 94.21% of the $12.79 billion volume
- July 2025: Sell-side remained dominant, with asks representing 60.44% of the $7.50 billion volume
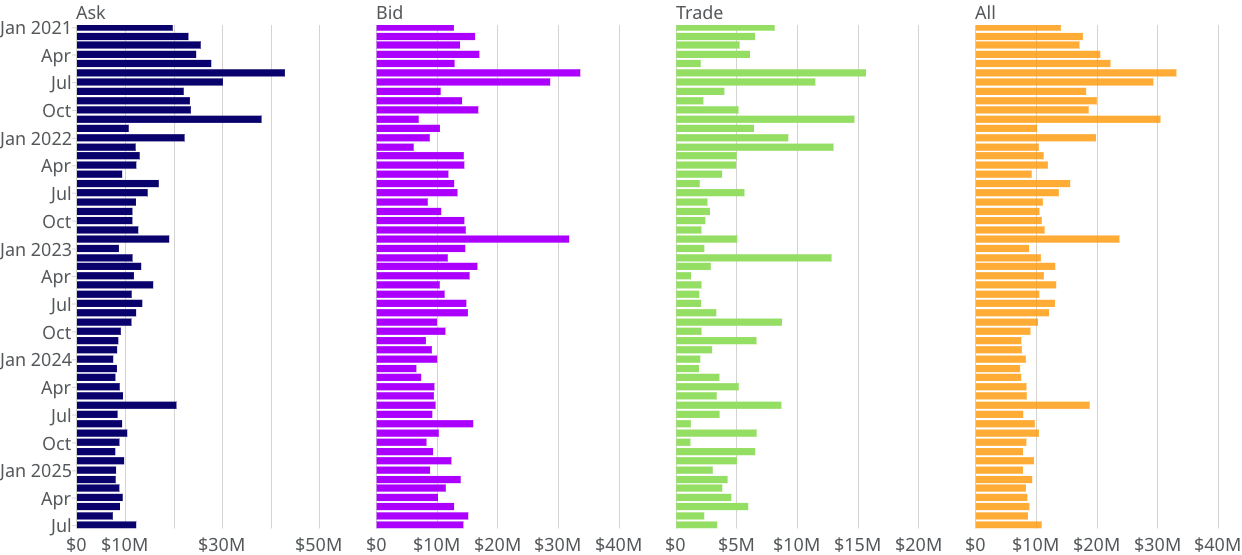
Monthly Mean Volume per Indication Type
The chart below presents the monthly average volumes for asks, bids, and trades over the period from January 2021 to July 2025.
- Asks:
- Highest ask volume: $42.86M in June 2021
- Lowest ask volume: $7.38M in June 2025
- July 2025 ask volume: $12.21M, up +65.4% from June 2025
- Bids:
- Highest bid volume: $33.59 million in June 2021
- Lowest bid volume: $6.12 million in February 2022
- July 2025 bid volume: $14.31 million, down -5.29% from June 2025
- Trades:
- Highest trade volume: $15.64 million in June 2021
- Lowest trade volume: $1.17 million in October 2024
- July 2025 trade volume: $3.38M, up +46.32% from June 2025
- All:
- Highest volume: $33.08 million in June 2021
- Lowest volume: $7.30 million in February 2024
- July 2025 volume: $10.86 million, up +26.43% from June 2025
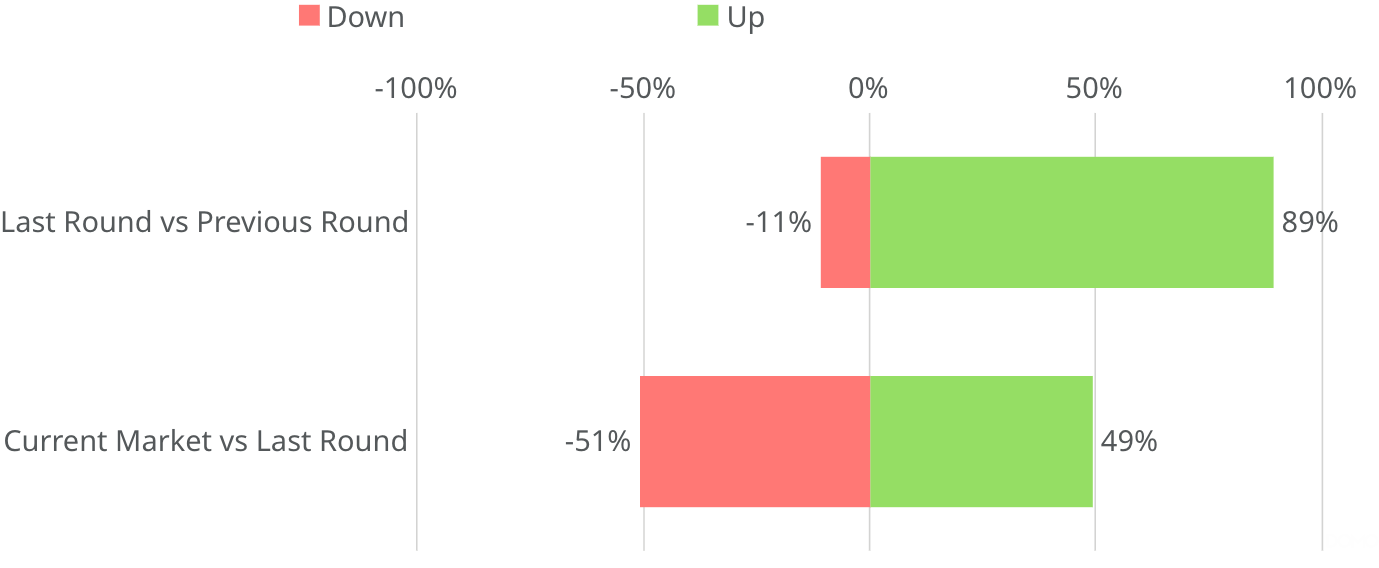
Proportion of Change in Valuation
The chart below highlights the ratio of companies in PM Insights' universe current trading levels relative to recent round valuations.
- Latest vs prior round: 89% of companies raised new funding at a higher valuation than their previous round
- Latest round vs current secondary market activity: 51% of companies are currently trading at lower valuations than their latest round
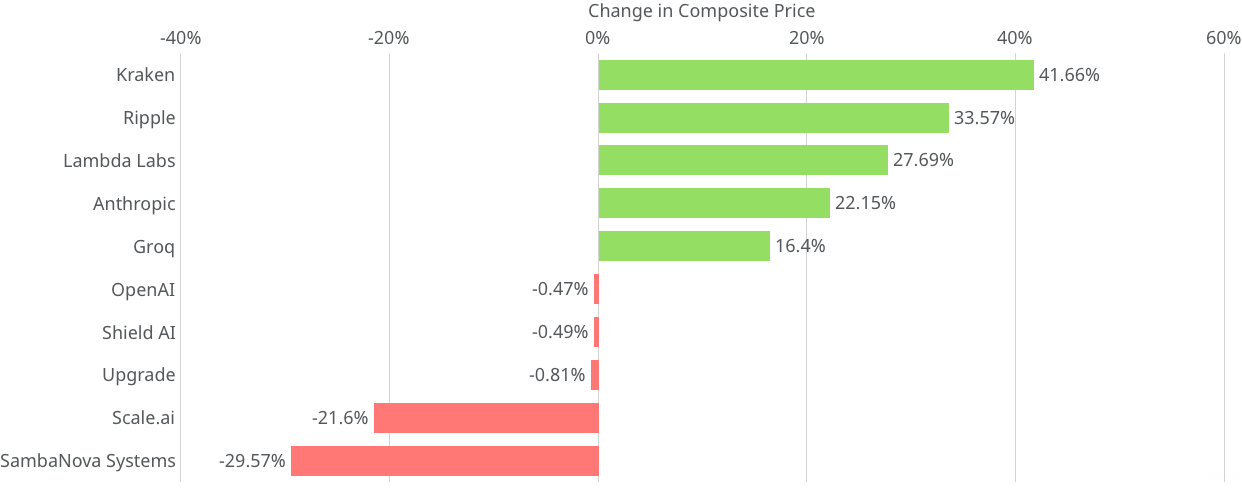
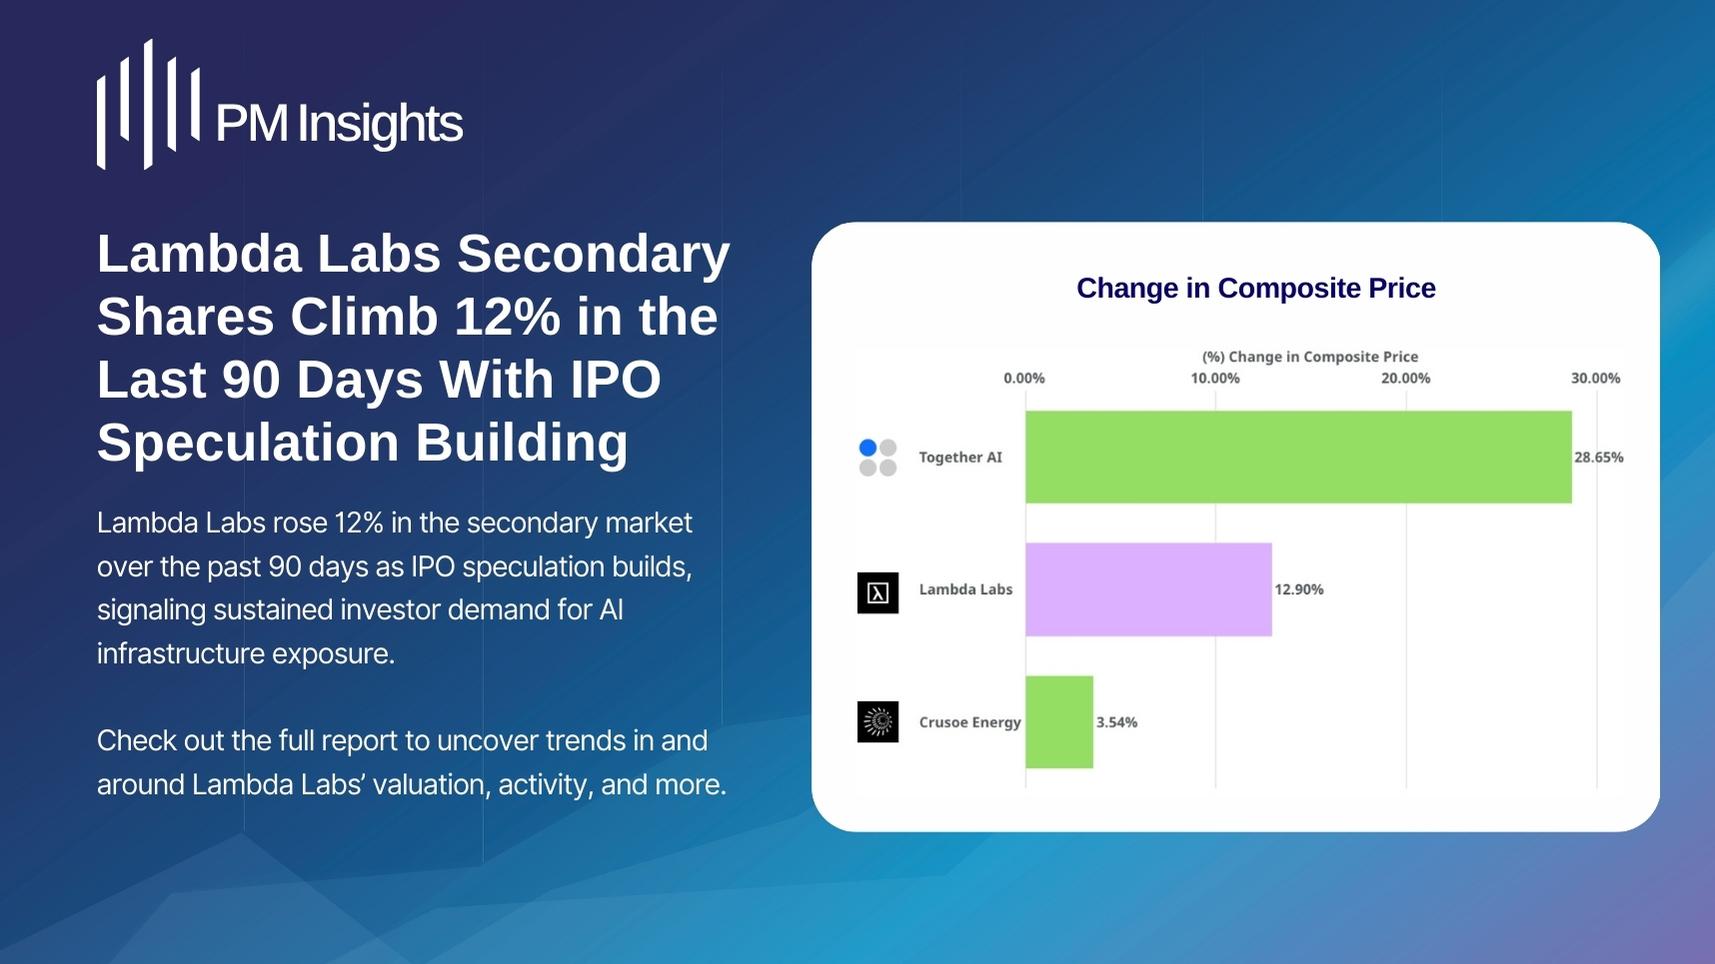
Change in Composite Price (MoM)
PM Insights highlights the top five and bottom five companies in terms of change in composite price between June 30, 2025 and July 31, 2025 with significant activities i.e. at least 3 institutional-level contributions—to identify those experiencing the most notable shifts in market sentiment.
- Strongest gain: Kraken's composite price rose by +41.66% from $25.95 to $36.76
- Largest decline: SambaNova Systems' composite price fell -29.57% from $37.60 to $26.48
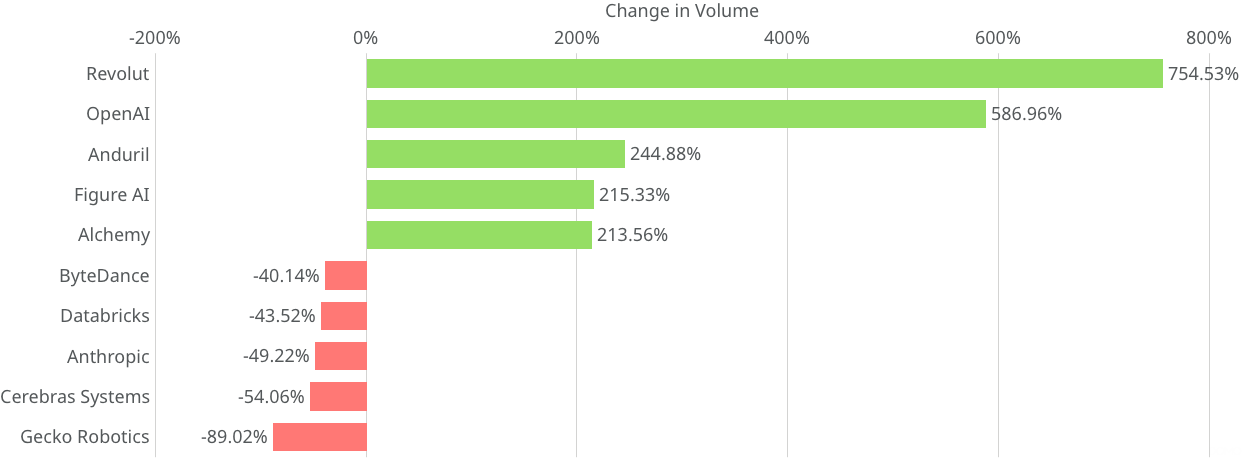
Change in Total Bid and Ask Volume (MoM)
PM Insights highlights the top five and bottom five companies with significant activities in terms of change in total bid and ask volume between June 30, 2025 and July 31, 2025.
- Largest increase: Revolut, up +754.53%, from $30 million to $256.36 million
- Largest decrease: Gecko Robotics, down -89.02%, from $11.06 million to $1.22 million
Most Active Names Performance Across All Sectors
Data as of July 31, 2025
.png)
* Price (USD) estimated based on secondary market activity observed by PM Insights. Valuation is estimated based on said price and share count from state filings and/or news in the public domain. Note that share count in calculations may change as new filing documents are obtained.
.jpg)
.jpg)
.jpg)
.jpg)
.jpg)
.jpg)
.jpg)
.jpg)
.jpg)
.jpg)
Ready to see it in action?
Schedule a demo with one of our experts
